India Economy This Week: Energy Relief, PMI and Monsoon Demand
India's near-term growth picture is being read through a dashboard of indicators this week, with energy costs, PMI activity readings and monsoon-linked rural demand each pulling the conversation in different directions.
Commentary & Analysis ·
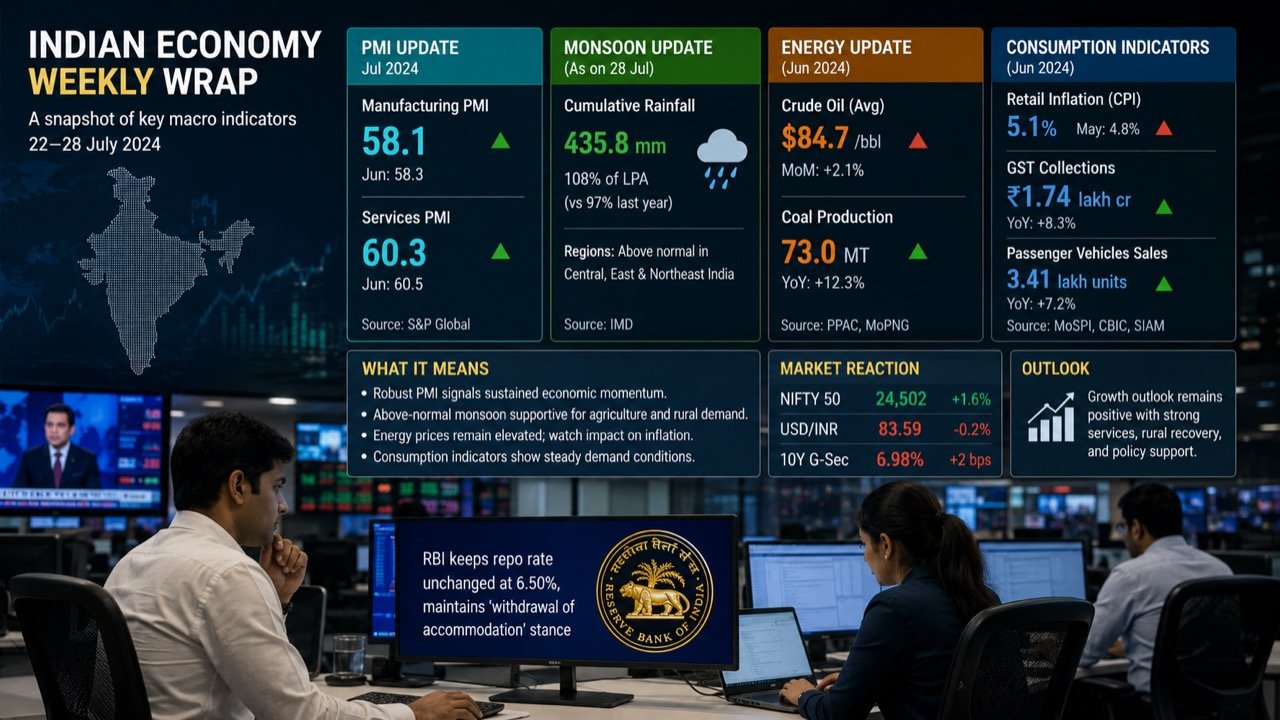
India's weekly economic read-out has put three signals in focus: relief on energy costs, the latest PMI activity data and the progress of the monsoon. As Business Standard's economy wrap highlighted, the near-term growth conversation is being shaped by multiple indicators moving together rather than any single headline number. That framing is worth dwelling on, because it runs against the grain of how economic news is usually consumed in India, where a single strong or weak print tends to dominate the conversation for days before the next data release resets the mood entirely.
Three signals, three channels
Each of the three indicators singled out this week matters through a distinct channel, and it is worth separating them before considering how they interact. Softer energy costs feed directly into inflation and corporate margins, giving both households and companies breathing room. For households, cheaper fuel eases the single largest recurring expense after food, freeing up disposable income for other spending. For companies, energy is a direct input cost across manufacturing, transport and logistics, so any softening shows up relatively quickly in margins and, eventually, in pricing decisions.
PMI readings, meanwhile, offer the fastest available snapshot of business activity across manufacturing and services. Unlike official output data, which arrives with a lag and is subject to revision, purchasing managers' indices are compiled from survey responses gathered in near real time, which is precisely why economists and market participants lean on them so heavily between the release of harder GDP figures. A firm PMI print signals that businesses are booking new orders, hiring and expecting demand to hold up; a weak one is an early warning that activity is cooling before the slowdown shows up anywhere else.
And the monsoon's advance influences rural demand, food prices and the confidence of the agricultural economy that still anchors consumption in much of the country. Agriculture's direct share of GDP has shrunk over the decades, but its indirect footprint remains outsized: a good monsoon lifts farm incomes, which in turn supports demand for everything from two-wheelers to consumer staples in the vast rural market that many listed companies depend on for growth.
Why no single number tells the whole story
The practical consequence of watching three channels rather than one is that stronger data in one area can be offset by pressure elsewhere. An encouraging PMI print means less if energy costs turn higher, because whatever margin or demand gains businesses register from brisk activity can be eroded by a renewed rise in input costs. Equally, a good monsoon can cushion urban weakness, since resilient rural consumption can offset softness in city-based spending even when urban indicators look shaky. This is why economists increasingly treat these releases as a dashboard, watching the trend across indicators rather than any decisive single number.
This dashboard mentality has practical implications for how policy is likely to respond as well. Central banks and finance ministries rarely act on one data point; they look for confirmation across multiple readings before adjusting rates, subsidies or spending. A single soft PMI print is unlikely to move the Reserve Bank of India, but a soft PMI print combined with a poor monsoon and rising energy costs would be a different matter altogether, and would likely accelerate discussion of supportive measures.
The households and businesses caught in the middle
It is worth pausing on who actually experiences these signals in daily life. For a salaried household in a city, energy relief is felt at the fuel pump and in the electricity bill, and it matters more when inflation elsewhere in the basket, such as food, is already running hot. For a small manufacturer, PMI-style demand signals translate into decisions about whether to add a shift, hire temporary workers or hold off on a planned expansion. For a farming family, the monsoon is not an abstract statistic but the difference between a comfortable season and a stretched one, with knock-on effects for how much they spend on consumer goods once the harvest comes in. Treating these three signals as connected, rather than isolated data releases, is simply a more accurate reflection of how the economy is actually experienced by the people living inside it.
What readers should watch
For readers tracking business and policy, the useful discipline is consistency: follow the same handful of indicators week after week, and note when they start moving in the same direction. Sustained energy relief plus firm PMI readings plus a normal monsoon would be a genuinely constructive combination, the kind that supports both rural and urban demand simultaneously and gives policymakers room to focus on longer-term reforms rather than firefighting. Divergence between them, by contrast, is usually the early warning that momentum is patchier than headlines suggest, and it is often in that divergence that the more interesting policy debates begin, over which sector needs support first and how much fiscal space is available to provide it.
This is also a useful lens for assessing corporate earnings commentary in the weeks ahead. Companies exposed to rural markets will be watching the monsoon closely for cues on demand; energy-intensive manufacturers will be parsing input cost trends; and export-oriented services firms will be reading PMI data for signs of order momentum. Investors and analysts who track all three together are better placed to judge whether an individual company's results reflect a genuine turnaround or simply a favourable one-off in a single indicator.
The NE Times View
The dashboard approach is the right one, and it deserves wider adoption beyond trading desks. Too much Indian economic commentary swings between euphoria and gloom on the back of one data point. The economy that matters to ordinary readers, fuel bills, job-creating business activity, rural incomes, moves through slow, compounding trends rather than dramatic weekly swings. Watching energy, PMI and the monsoon together is a healthier habit than chasing each week's loudest number, and it is the habit this newspaper will keep encouraging.
There is also a broader lesson here about how economic literacy is built. Readers who learn to track a small basket of indicators over months, rather than reacting to whichever number makes headlines on a given day, develop a far more reliable sense of where the economy is actually heading. That is a more demanding form of attention than scanning a single alarming or reassuring statistic, but it is also the only form of attention that reliably separates noise from signal. This newspaper will continue returning to these same three markers, energy costs, PMI and the monsoon, precisely because their combined trajectory, not any one week's reading, is what will determine whether the coming quarters bring genuine relief or merely a temporary reprieve.
Key takeaways
- Energy costs, PMI activity and the monsoon are the three signals shaping this week's economic read-out, each working through a different channel: inflation and margins, business activity, and rural demand respectively.
- Strength in one indicator can be offset by weakness in another, which is why economists are increasingly treating these releases as a dashboard rather than isolated headline numbers.
- Sustained improvement across all three signals together would mark a genuinely constructive combination, while divergence between them is typically an early warning of patchier underlying momentum.
- Readers, businesses and policymakers alike benefit from tracking the same handful of indicators consistently over time rather than reacting to any single week's data.
- The NE Times will continue to encourage this dashboard habit as a healthier alternative to reacting to whichever number dominates the headlines in a given week.
You may also like to read
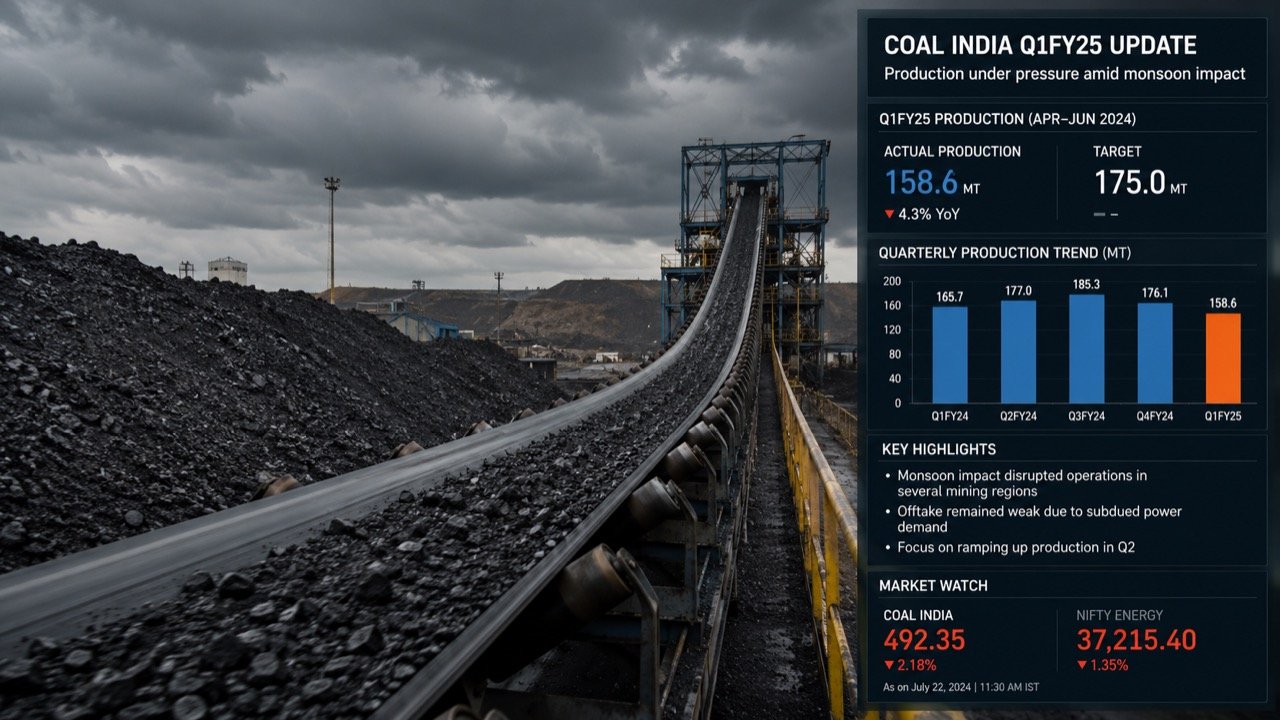
Coal India Q1 Output Falls, Raising Monsoon Power Supply Questions
A reported first-quarter production decline at Coal India has put mining trends, monsoon disruption and power-sector inventory planning under scrutiny, given coal's central role in keeping India's lights on.

FMCG Demand Outlook Brightens on Rural Recovery and Stable Prices
Consumer goods companies are turning more upbeat as rural demand recovers, input costs hold steady and everyday purchases pick up, offering a telling read on the health of Indian household spending.
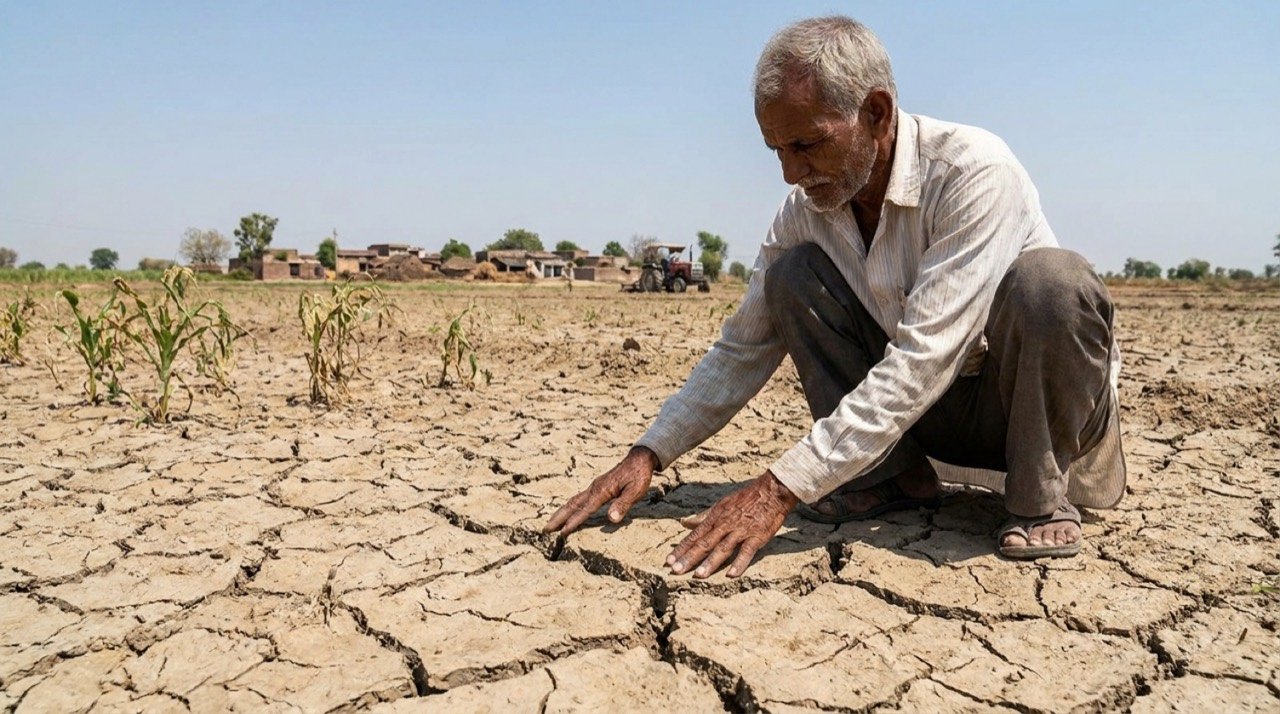
El Nino Risk Flags 111 Districts for Monsoon Deficit Worry
A fresh assessment has identified 111 districts as highly vulnerable to an El Nino-linked monsoon deficit, with Maharashtra and Madhya Pradesh accounting for a large share and farm incomes at stake.
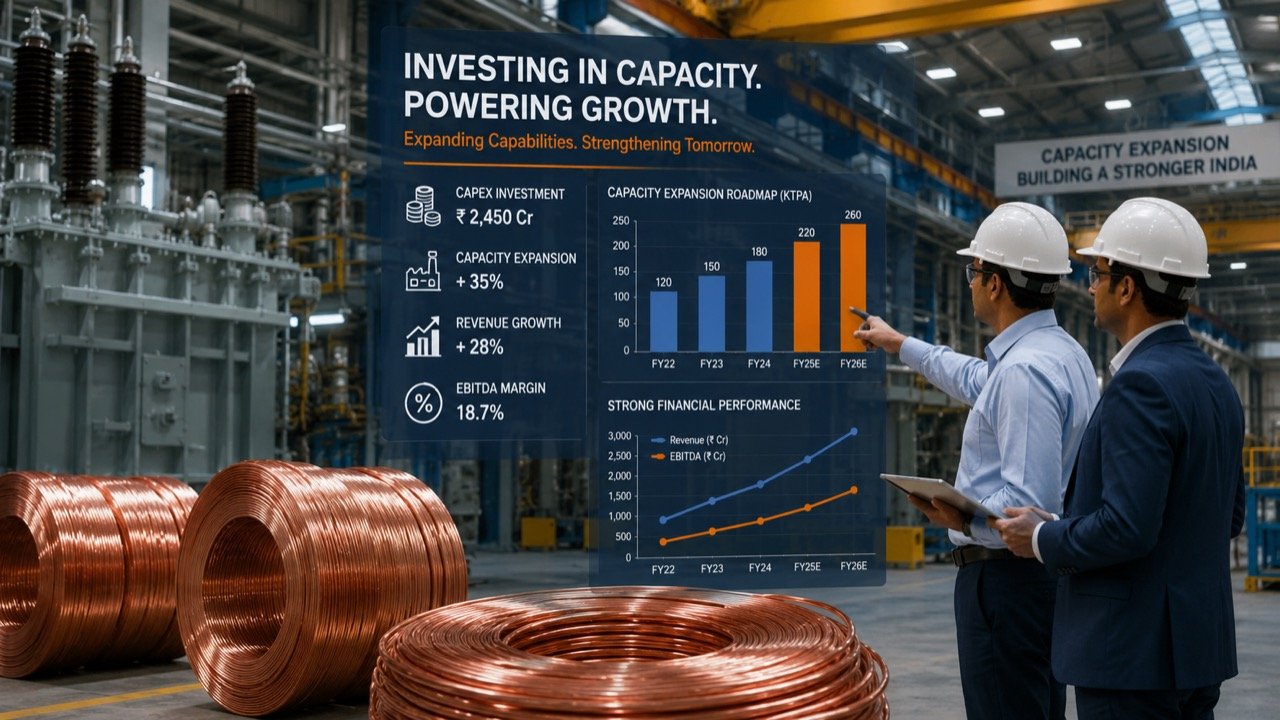
India Copper Capacity Push Grows Urgent as Clean Energy Demand Rises
Rising demand from solar, wind, electric vehicles and grid expansion is turning India's copper supply into a strategic industrial question, with capacity gaps threatening costs and project timelines.
More from this section
More
Adani Case: US DOJ Pushes for Permanent Dismissal of Charges
The US Department of Justice has urged a judge to permanently dismiss charges against Gautam Adani, calling the case legally flawed — a reversal with consequences for markets, diplomacy and cross-border enforcement.

Akasa Air Inducts 40th Aircraft in Indian Aviation Scale-Up
Akasa Air's 40th aircraft, ferried to Bengaluru via Seattle, Reykjavik and Cairo, marks a fleet milestone for the young carrier and a fresh signal that India's aviation market remains firmly in expansion mode.
BARC Ratings Suspension Leaves Indian TV Industry Flying Blind
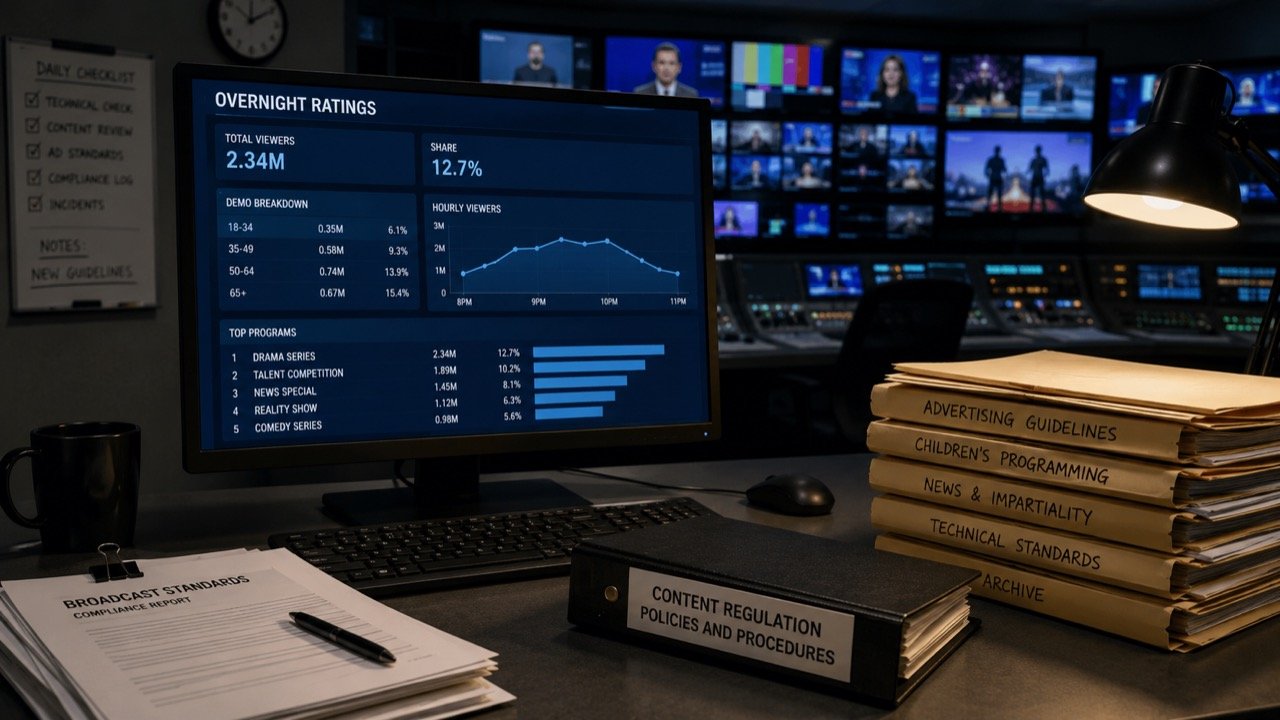
BARC's pause on television ratings has put India's broadcast measurement system under fresh scrutiny, leaving broadcasters, advertisers and media planners without the weekly audience data that anchors the TV economy.